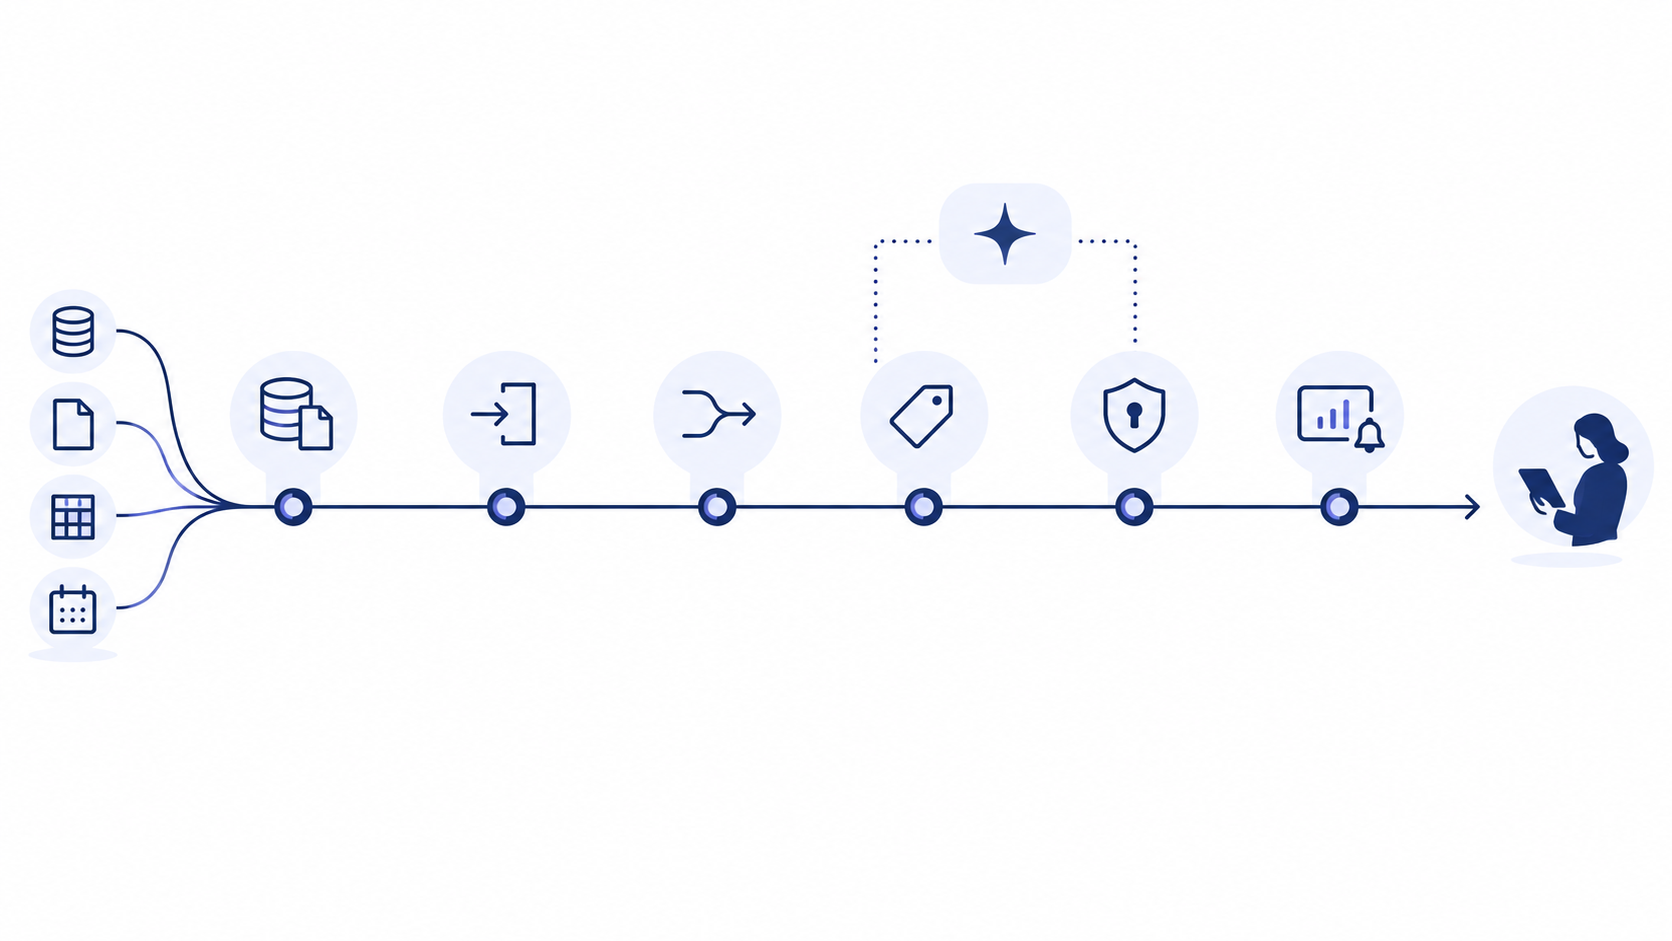
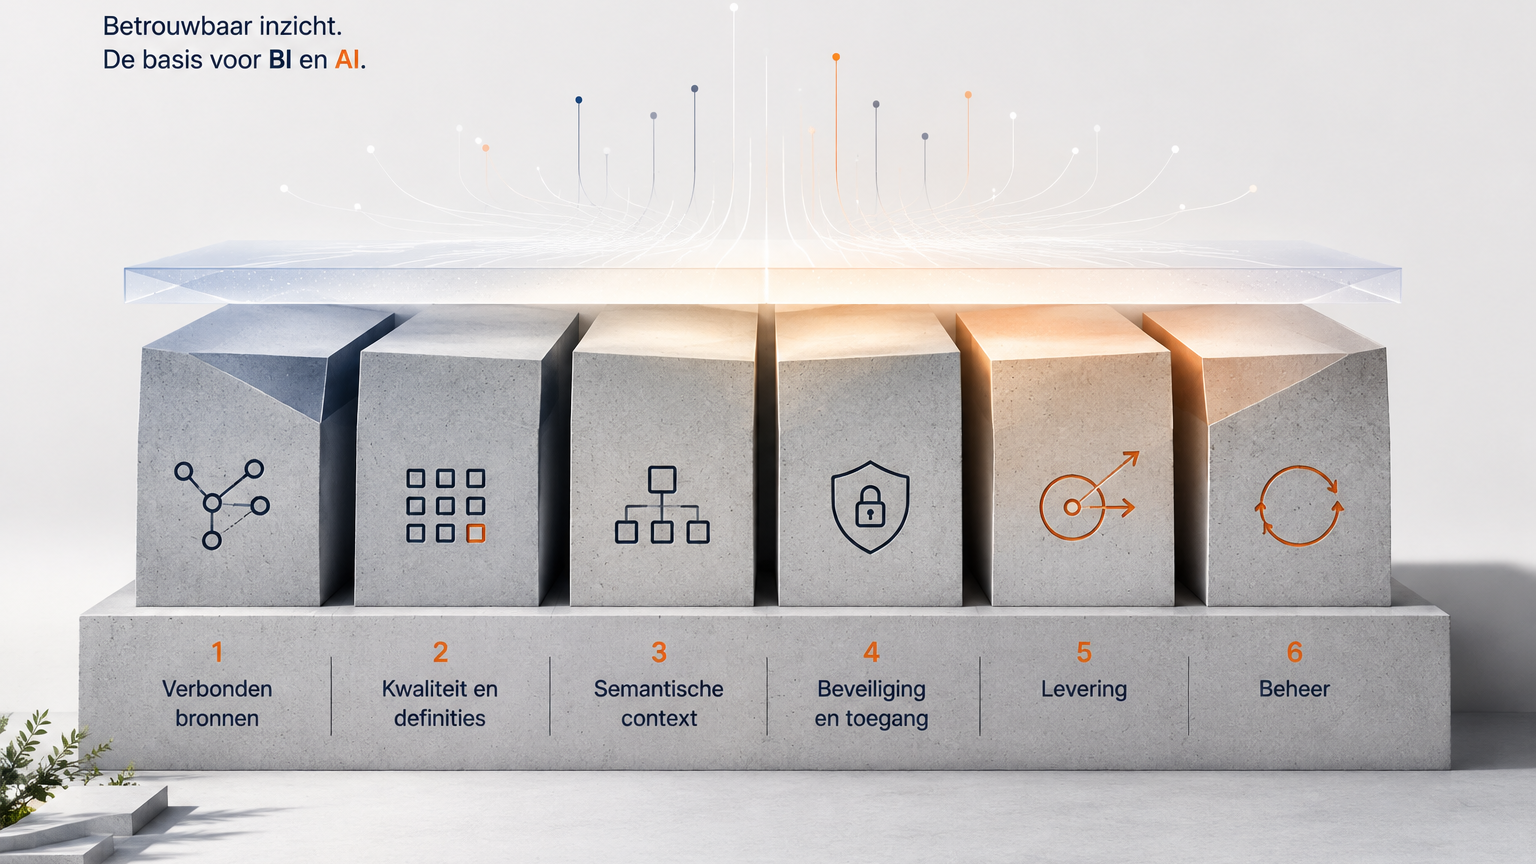
Between the moment an order is recorded in your ERP and the moment someone asks a plain-language question about it, there are six stations. This article walks through them in plain language, with what happens at each one and what breaks if you skip it. Aimed at people who decide about this kind of investment but do not work with it day to day.
What this article delivers
- You can retell the chain from source to answer in six steps.
- You recognise at which station a problem arises when a number is off.
- You understand where RAG fits in the whole and why it is the last step.
- You can judge whether a vendor's offer covers the whole chain or a single station.
Station 1. The source
It starts with the systems already in place. An ERP that knows customers, orders and invoices. A service desk with tickets. A planning package with hours. Often an industry-specific package as well, and around it spreadsheets in which people have plugged the gaps.
What is important to remember: each of those systems stores data the way the system needs it, not the way you want to read it. An ERP is built to push an order through a process, not to answer a question about margin. That is not a shortcoming of the ERP.
What goes wrong if you stop here: you have four systems that each know their own part of the answer and no system that sees the whole. The questions that need the whole are then answered once a year in a spreadsheet and not asked the rest of the year.
Station 2. Ingestion, the bronze layer
This is where the data comes in, unchanged, exactly as it appears in the source. That happens via connectors: software that fetches automatically on a fixed cadence.
That it arrives unchanged seems redundant, but it is not. This is the only place where you can later demonstrate where a number came from. If someone asks in six months why the figure in March was different, you can show it rather than reason it out.
What a good connector does on top of that: it checks whether what is coming in looks the way it should. The number of records, the range per field, the ratio between categories. If it deviates, a signal goes out before the report is run.
What goes wrong without it: a vendor renames a field, the integration keeps running, and from then on that column comes in empty. Three months later someone notices the numbers are “a bit off”, and then the investigation starts with the question of since when, exactly.
Station 3. Transformation, the silver layer
This is where cleaning happens. Duplicate records are merged. Date formats are aligned. A customer with three different names in three systems becomes one customer. Address data is normalised. Missing values are flagged instead of silently set to zero.
This is the station where most of the work sits and where most of the craftsmanship goes. It is also the station that is least visible in a proposal, because its result is that nothing remarkable happens.
A detail that makes it concrete. At Runderkamp, a PLU — the code that identifies a product — turned out to mean slightly different things in different contexts. The same held for pack sizes and pricing agreements. Consolidating around 170 suppliers into more than 1,400 standardised products and PLUs is silver work.
What goes wrong without it: you connect systems that continue to disagree. The problem becomes more visible instead of smaller, and trust in the new solution drops at the first meeting where two figures sit next to each other.
Station 4. The semantic layer, the gold layer
This is where concepts get their meaning. Revenue, margin, lead time, active customer. Defined once, with an owner attached, in a place where systems can read it.
These three layers together — bronze, silver and gold — are called the medallion architecture. The name matters less than the reason: raw data, cleaned data and decision-ready data are three different things, and it pays to keep them apart.
The gold layer also holds the semantics of the data itself, not just of the concepts. What does a status column with values 1, 2, 3 and 7 mean. Which values can appear together. Which rules apply when summing. That is knowledge that at most companies lives in two or three people's heads and is written down nowhere.
What this delivers: the board's dashboard, the customer's portal and an AI assistant all read from this layer and therefore give the same answer to the same question. Change the definition, and everything changes with it. One adjustment instead of twelve.
What goes wrong without it: each report picks its own answer to the question of what margin is. That does not stand out as long as no one lays them side by side, and it stands out sharply as soon as someone does.
Station 5. Access
This is where it is defined who is allowed to see which data. The technical term is row-level security: access at the row level. Every user sees only the rows that belong to them, regardless of the route they use to request them.
The difference from screen-level access becomes clear as soon as there is more than one route. With screen-level access, the report determines what someone sees; if an export, a portal or an assistant is added, the rule has to be built in there again. If that gets forgotten anywhere, a door stands open that no one has noticed.
With row-level access, everything that runs on the data inherits the same rule. That makes three things possible that otherwise remain manual work: one dataset for all your clients where each party sees only their own part, adding a new customer without having to build an environment, and an assistant that gives a different answer per user because it sees different data per user.
CentreBlock is the clearest example of this in our own practice: multiple clients in a single analytics environment, each with sight of only their own figures, with eleven standardised KPIs so that comparison between clients and periods carries meaning.
What goes wrong without it: one question phrased slightly more broadly, and something appears in the answer that should not have been there. That cannot be taken back.
Station 6. Delivery
The last station is the question of how the outcome reaches a person. There are three forms, and they are not interchangeable.
A dashboard, for exploratory questions. Where is our margin sitting, which customer group is growing, what has changed. There you want to look around and drill down.
A signal, for monitoring questions. Is something running off the rails, and who needs to know. There you want a message at the moment it happens.
A portal, for external parties who want to see their own part without you having to send it to them.
The rule of thumb we use: if the action is predictable, it does not belong on a screen. If you can write down in advance what needs to happen when a threshold is crossed and who has to do it, you build a signal and not a dashboard.
What goes wrong without it: the insight exists and no one acts on it. A dashboard requires a habit, and habits fade. After a quarter, only a handful of people still open the screen.
And where does AI fit in?
On top of these six stations, and not between them.
The technique you usually encounter here is called RAG. The model first looks up the relevant piece of information in your data and only then formulates an answer, with that piece as its basis. That is the difference with a chatbot drawing from its general training.
What RAG needs is exactly the chain above. It has to search in data that has been brought together from multiple sources — stations 2 and 3. It has to know what a field means in order to pick the right one — station 4. And it has to see different data per user — station 5.
That is why the order in this article is not reversible. An AI layer on station 1 is a chatbot that makes things up. An AI layer on stations 4 and 5 is an assistant that gives answers based on your own figures.
The core in one sentence.
The difference between an assistant you can trust and an assistant that is confidently wrong is not in the model. It is in the four stations underneath.
What it costs to skip a station
- 2. Ingestion. What you notice: figures deviate without an identifiable cause. When you notice it: months later, by chance.
- 3. Transformation. What you notice: the same customer or the same product is counted twice. When you notice it: at the first comparison between two sources.
- 4. Semantics. What you notice: two reports give two answers to the same question. When you notice it: in a meeting, usually at an inconvenient moment.
- 5. Access. What you notice: someone sees data that was not meant for them. When you notice it: after the fact, and then it is too late.
- 6. Delivery. What you notice: the insight exists and no one acts on it. When you notice it: after a quarter, when the dashboard is quiet.
Limits
This chain describes what is needed to get from source to a trustworthy answer. That does not mean every company has to build out all six stations in full.
If you work with a single system that holds almost everything, stations 2 and 3 are considerably lighter. If you share nothing outside your own organisation, station 5 is simpler. If you make monthly decisions, station 6 is less critical than for an operation that adjusts daily.
What we do not do: build an AI layer on a foundation that is not there, not even when the client asks for it and the budget is on the table. Not out of principle, but because the result is an assistant that impresses for the first weeks and then drags trust in all the numbers down with it.
These are solution patterns, not guaranteed outcomes. What it delivers in your situation depends on how sharp the question is that you start with.
Glossary
- Connector — Software that automatically pulls data from a source system, including checks and provenance.
- Bronze, silver, gold — The three layers of the medallion architecture: raw, cleaned, decision-ready.
- Semantic layer — The place where what a field and a concept mean is defined, readable by systems.
- Row-level security — Access at the row level: every user sees only their own rows, whatever route they take.
- RAG — An AI approach where the model first looks up the relevant information in your data and only then formulates an answer.
- Sharing Engine — The layer in which dashboards, portals and signals are delivered from the same data.
In closing
Six stations sounds like a lot. In practice you do not build them all in full width, but narrow: one stream from source to outcome, for one question that really matters, with all six stations in it.
That can be done within weeks. And the second question is considerably cheaper after that, because half the work is already in place.