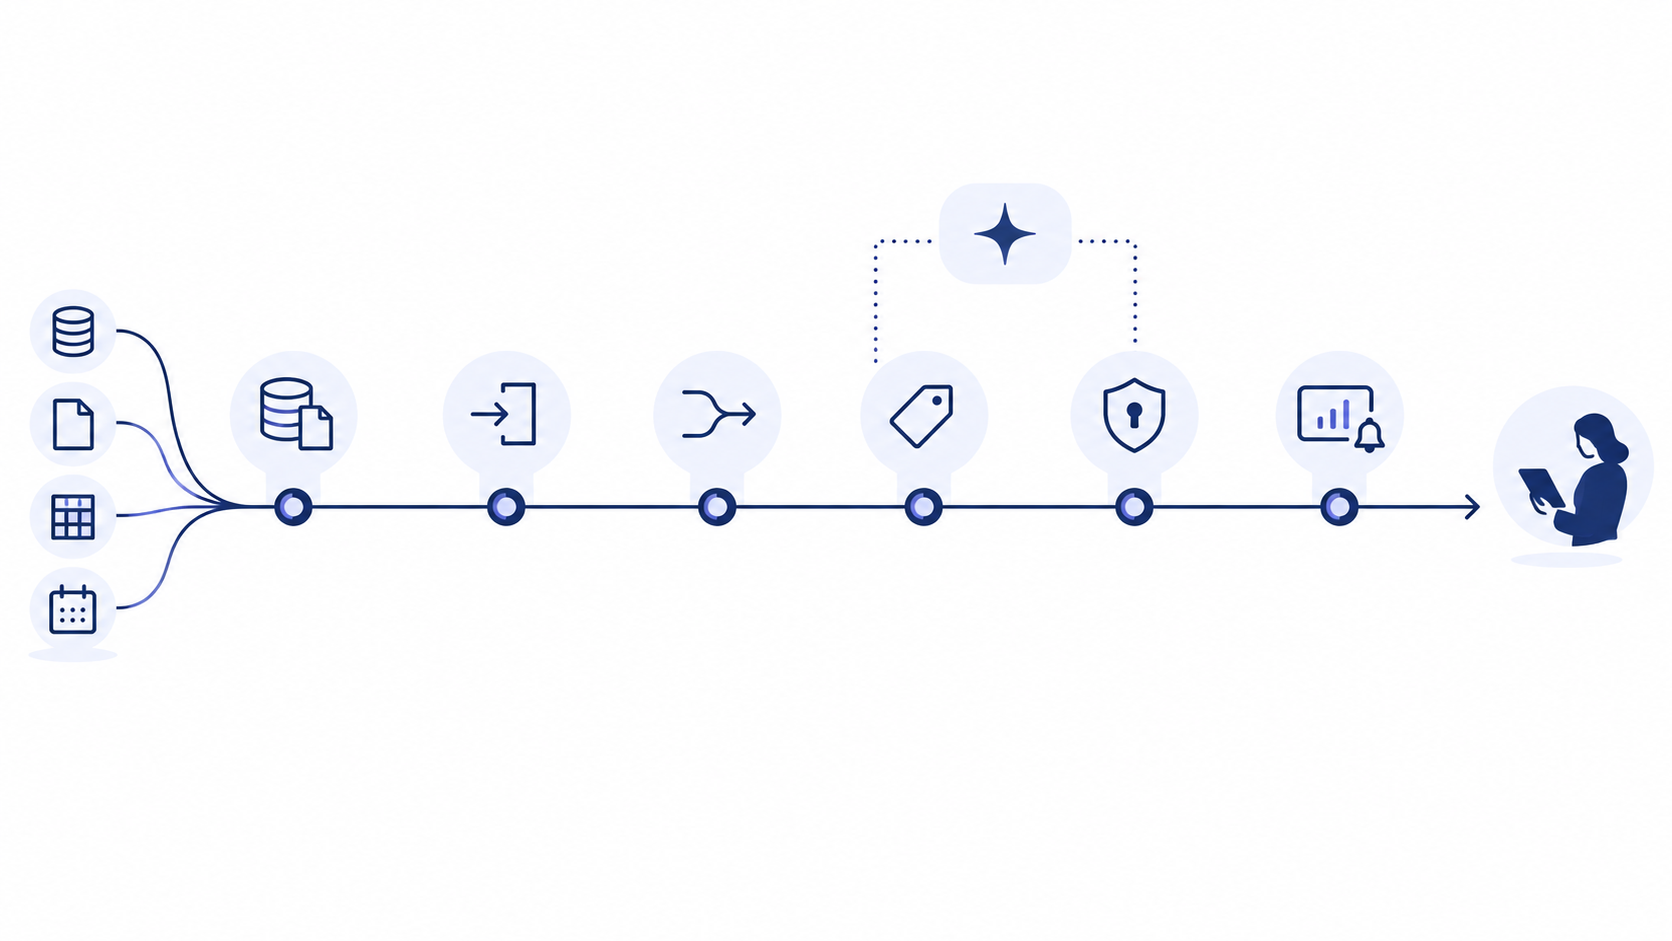
Always-on reporting and insight give decision-makers, teams, and customers access to the same trusted numbers without waiting for manual spreadsheet work. Impacture creates this layer on top of disconnected operational systems, turning fragmented data into dashboards, automated reports, and recurring insight that people can actually use.
The core problem in most organizations is not a lack of data. It is that data sits in different systems, follows different definitions, and is manually stitched together too late to support confident action. That leads to conflicting reports, delayed decisions, and a poor foundation for customer-facing analytics.
Impacture solves this by creating one governed intelligence layer above your existing systems. That layer standardizes KPI logic, supports internal and external reporting, and makes it possible to deliver insight as part of the service or software experience.
Unified analytics across operational systems
Most organizations rely on multiple operational systems — ERP, CRM, WMS, field-service tools, finance platforms, customer apps, and spreadsheets. Each source holds part of the story, but none of them provides the full picture on its own.
Impacture unifies those sources into one analytical layer — not by replacing systems, but by connecting them, standardizing them, and making them usable for internal teams, customer portals, partner views, and automated reporting.
A practical example: an increase in returns (WMS) combined with a drop in customer satisfaction (CRM) points to a product issue that can be traced in the ERP. Without unified analytics, you might only notice this weeks later when teams compare reports. With a combined view, you can act the same day.
Dashboards for teams, customers, and partners
A dashboard is only valuable if it shows up-to-date data and leads directly to action. Static reports sent weekly by email are too slow for operational decisions. Real-time dashboards give team leads, operations managers, and executives continuous insight into the metrics that matter.
Design dashboards based on role and decision level. An operational dashboard for a warehouse manager shows order status, picking speed, and inventory levels. A strategic dashboard for a CFO shows cash flow, margins, and forecast deviations. Don't mix these levels: executives scrolling through hundreds of operational rows lose clarity.
Self-service BI plays an important role, but the bigger value is that the same governed layer can support employees, customers, and partners. Users can explore trusted data through dashboards, drill-downs, or recurring reports without creating their own versions of the truth.
Cross-system KPI tracking: consistent metrics across departments
The biggest risk in enterprise data analysis is inconsistency. When sales defines "revenue" as invoiced amounts and finance defines it as received payments, you end up with two versions of the same metric. This problem scales with the number of systems and departments.
Cross-system KPI tracking solves this by defining metrics centrally and calculating them from a single source. Use a semantic layer as the technical backbone: it translates raw data from ERP, CRM, and WMS into standardized metrics. Whether you use Power BI, Tableau, or another tool, the underlying calculation remains identical.
From raw data to business-ready insights: Silver and Gold
Raw data from operational systems is rarely ready for reporting. Fields are inconsistent, date formats vary, and duplicates distort results. The medallion architecture provides a structured way to refine data step by step.
- Silver layer: data is cleaned and validated (handling nulls, removing duplicates, standardizing fields).
- Gold layer: data is aggregated and modeled for specific use cases (finance cubes, sales reports, dashboards).
The Gold layer contains only business-ready data that end users can directly consume. Automate the transition between layers and enforce validation rules to prevent poor-quality data from reaching dashboards.
From web analytics to customer value
Web analytics on its own can show traffic and behavior, but it rarely shows the full business picture. For organizations that want to connect digital engagement to customer value, revenue, operations, or service outcomes, a broader data layer is needed.
Impacture connects website and product usage data with CRM, ERP, WMS, and other operational sources so teams can move from isolated traffic metrics to customer-ready insight, whitelabel reporting, and better decisions.
Automated reporting for teams and customers
Manual reporting is time-consuming, error-prone, and outdated. Automated reporting should not only support executives; it should also support teams, customers, and partners that rely on timely insight.
Start by identifying reports that are manually compiled from multiple sources. Define their data sources, calculations, format, and recipients. Then automate them from one governed layer so the same logic can support internal use and customer-facing delivery. Impacture generates reporting directly from the Gold layer, ensuring validated and up-to-date data for executives, teams, customers, or partners.