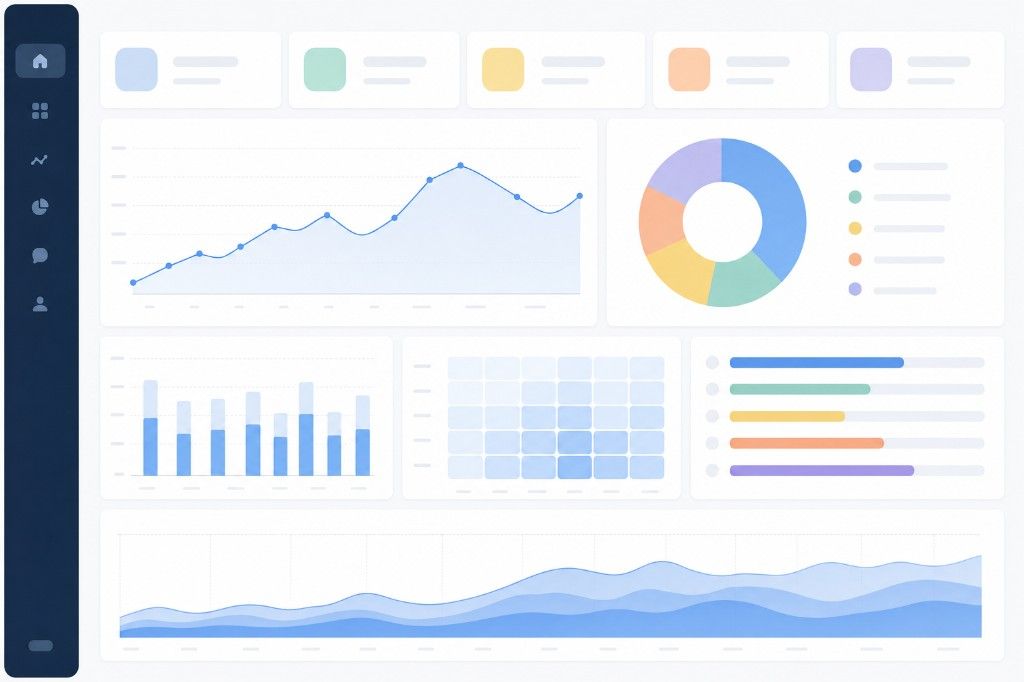
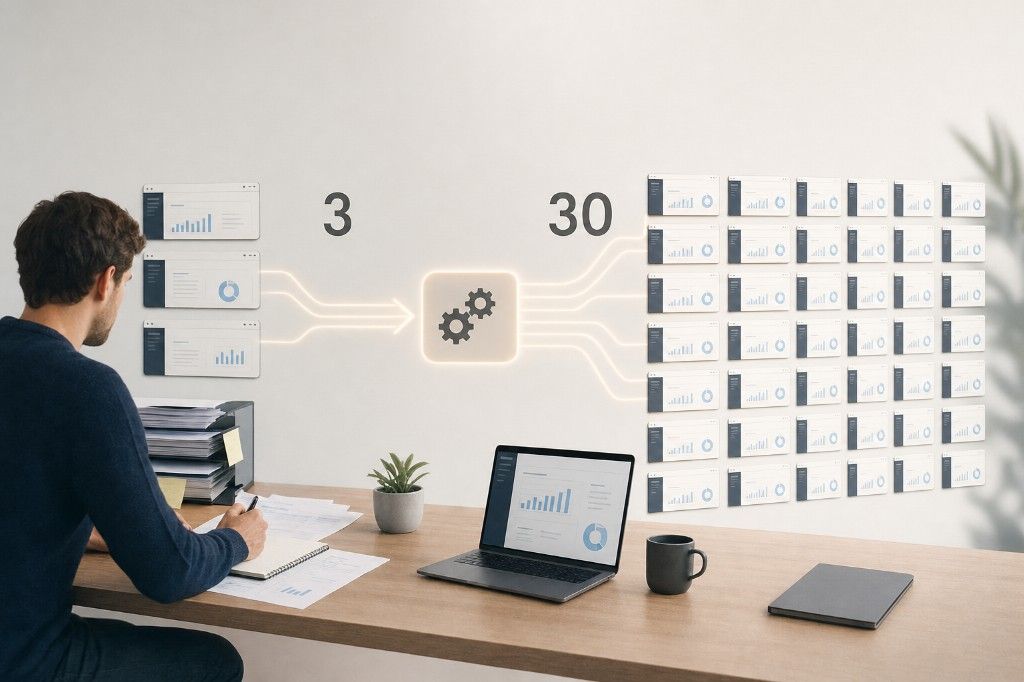
Many boards ask the wrong question. They ask for a better dashboard, while the actual problem sits in the difference between signalling and reporting: one shows what happened, the other intervenes at the moment it counts. Anyone who does not make that distinction keeps running behind the facts. In practice we see at clients that this choice only becomes sharp once data must be used not only for overview, but also for action.
What is the difference between signalling and reporting?
Reporting looks back: an overview of what happened in a past period, bundled in figures and charts. Signalling is the reverse. It is an alert at the moment something deviates from the norm, meant to take action immediately.
The difference therefore sits in timing and purpose. A report answers "what happened", a signal answers "what needs to happen now". Both are needed, but they solve a different problem.
Signalling and reporting in a data platform
In a data and AI platform the discussion often turns on dashboard versus signal: should the data become visible in an overview, or should the system itself take action as soon as a deviation occurs? On a governed platform (a managed environment with fixed rules for access and quality) both run on the same underlying data.
Choose a dashboard if the question is about trends, comparison or accountability. Set up a signal if a deviation has immediate consequences for delivery, planning or customer satisfaction. A dashboard for example shows falling revenue per month; a signal reports that a stock level drops below the critical threshold today.
Which form supports faster decisions?
Signalling supports faster decisions because it removes the delay between event and action. A dashboard asks for interpretation by a person; a signal is already interpreted and points directly at the problem.
That does not mean reporting is redundant. A board that only steers on signals misses the broader picture to underpin strategic choices. With an AI layer this weighs more heavily than with a dashboard: in a chart you see a kink, in a standalone signal you do not.
Why both work on the same data layer
Signalling and reporting work best when they come from the same, unambiguously defined data layer. As soon as a dashboard and a signalling system use separate data sources, two versions of the truth arise, and that costs trust.
Therefore set up one layer on which both reporting tools and signalling logic rest. That prevents a signal from claiming something different from what the dashboard shows a day later. Governance on that layer, such as fixed ownership per data concept, determines whether both forms remain reliable.
What happens if you only report or only signal?
Only reporting means an organisation keeps reacting behind the facts: the problem is already over by the time it appears in an overview. Only signalling produces standalone alerts without context, so nobody sees whether a deviation is a one-off or a pattern.
Messy data is work, and the conditions to let both forms function well are not a luxury. Without unambiguous definitions a signal stalls on the same errors that also make reports unusable.
The choice between dashboard or signal is therefore not a matter of preference, but of what the situation asks. Signalling versus reporting is not about which form wins, but about a data layer that can feed both forms at the same time. Unsure which form fits your organisation? Book a Discovery Call and we will look at it together.