What you get out of this article
- You understand why an AI answer is more dangerous than a wrong dashboard.
- You can name the four problems that sit underneath almost every failed pilot.
- You know the sequence that does work, and why it cannot be reversed.
- You know when a data platform is not the right choice for your company.
What we mean by a data foundation
A data foundation is the whole of connections, definitions, meaning, access rules and stewardship that makes information from separate systems usable for decisions. It is not a product and not a server. It is a capability you build up and maintain, just like bookkeeping.
That comparison with bookkeeping is more useful than it seems. Bookkeeping is not exciting either, the work also sits in agreements and discipline, and you also only notice it is missing the moment you have to answer a question you need a hard answer to.
The problem is not that data is missing
Almost every company we speak to already has the information. It just sits spread across systems that were never designed to work together, and that were each bought for good reasons.
An ERP that knows the customers and the invoices. A service desk that knows the tickets. A planning package that knows the hours. Measurement software or an industry-specific package that captures the actual work. And around that, a collection of spreadsheets in which people have filled the gaps between those systems.
That is not sloppiness. It is the normal result of fifteen years of sensible individual purchases. For years, spreadsheets were the best available solution for exactly that problem, and in some places they still are.
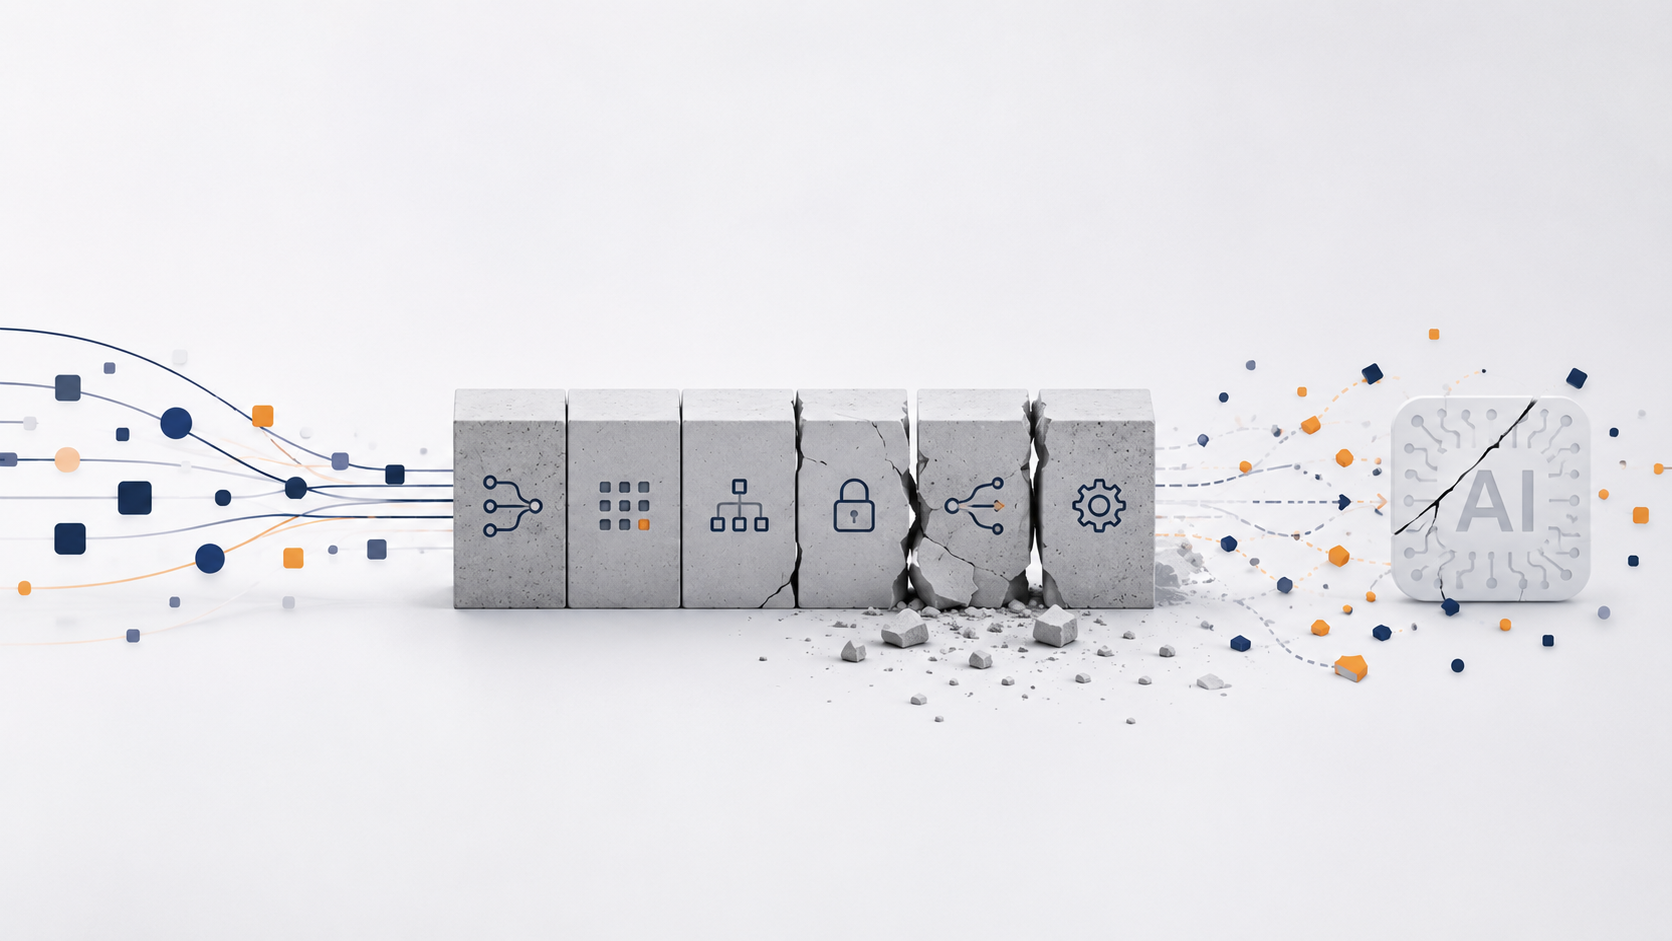
What sits under a failed AI pilot almost always falls into four categories.
One. The sources are not really connected
“We already have everything connected” in practice often means: someone exports it every Monday. An export is a snapshot without lineage. If the source renames a column, the export just keeps running with an empty column and no one gets an alert. And if that person is on holiday, there is no data that week.
Two. A concept means something different in three places
Ask three departments how many customers you have and you get three numbers. Sales counts accounts, finance counts debtors with revenue this year, service counts active contracts. All three are correct. All three measure something different. As long as people talk to each other, the conversation corrects that difference. Software does not talk back.
Three. The meaning of a field lives in people
In almost every database you find columns with codes whose meaning has never been written down. A status column with the values 1, 2, 3 and 7, where that last value was entered once for a specific case and is now only known to one or two people in administration. They are the semantic layer of that company, and they are documented nowhere.
Four. Access is arranged at screen level
As long as people reach data through reports, you can manage access per report. That works right up until a second route is added: an export, a portal, or an assistant that reads the underlying data itself.
Why AI makes that weakness more visible than reporting ever did
This is the point the article turns on, and it is rarely made.
A dashboard shows a number in context. You see the chart next to it, you see the previous period, you see that the line has an odd kink. If something is off, it stands out and you pick up the phone. The format itself invites doubt.
A language model gives you a sentence. Fluent, complete, confident. There is no margin of error attached, no source, and above all no note that the question could be interpreted in three ways and that the model picked one.
AI does not repair a weak information foundation.
It increases the speed and the scale at which the consequences of that weakness spread.
That is not because the technology is bad. It is because a language model is built to always answer. Ask it about your revenue with your ten largest customers and it gives a number, even if three systems use three revenue definitions. You do not get a warning that the question was ambiguous. You get an answer.
So the risk is not that AI does not work. The risk is that it works convincingly on a foundation that does not deserve it.
The sequence that does work
There is a sequence in this work and it cannot be reversed. Each step leans on the previous one.
- Centralize. The sources that together contain the answer come together automatically and repeatably.
- Standardize. A concept gets one meaning, and that meaning gets an owner with a name.
- Optimize. The data is cleaned and modelled so it is usable for the question you are asking.
- Automate. What used to happen manually each month happens on its own, including the checks that flag when something drifts.
- Visualize. The output lands in the place and at the moment where the decision is made.
- Share securely. External parties get their own view, with a boundary that lives in the data and not on the screen.
Automation amplifies what is already there. Automate a process in which one concept has three meanings, and you produce those three meanings faster and at greater scale. That is why step two cannot be skipped, however tempting that is because it is the least technical and most political step.
How we set up an engagement
The practical translation of that sequence is shorter than people expect, and that is by design.
- Business discovery. We decide which outcome is worth starting with, and who suffers if it does not arrive.
- Source and connector analysis. Which systems together contain the answer to that one question, and no more systems than that.
- Set up the foundation. The connections, the layers, and the environments in which work is built and tested.
- Data modelling and governance. Recording the definitions in the place where reporting picks them up, with an owner per concept.
- Build BI. Deliver the first outcome that someone actually uses.
- Build AI. Only here, and only if everything above is in place.
- Live and continuous operations. Checks that notice a source has changed, and someone who gets an alert.
The temptation is to make steps three and four as broad as possible and only then deliver something. We have tried that. The result was an architecture the builders were rightly proud of and that the business had nothing to do with for six months. In those six months the urgency evaporated and the question “what was this for again” was slowly asked in earnest.
The MVP principle.
Start with one thin, valuable flow from source to outcome. Make the architecture underneath reusable, but do not build the whole future platform before the first business result has been proven.
What this delivers in practice
CentreBlock delivers impact analytics to several customers at once. Every customer wants to see their own numbers, no one may see anyone else’s, and comparisons across periods have to be meaningful.
What was built: over a million visitor records flow in structured, eleven KPIs have been standardized so every customer is measured by the same yardstick, and seven comparable reporting periods have been set up so a change really is a change and not a difference in method. On top of that runs the patented Impact Score.
The outcome that mattered: the reporting lead time went from days to minutes.
What belongs alongside that: this worked because the question was sharp. CentreBlock knew exactly which outcome it needed, and that made the choice of which sources did and did not participate easy. These are solution patterns, not guaranteed outcomes.
When this fits and when it does not
Strong match when
- Multiple systems together hold the answer to a recurring question.
- There is a concrete question that is currently answered by hand too often.
- Someone can be appointed as owner of the definitions.
- You report to external parties who want their own insight.
- Growth now means more manual work.
- You are considering AI and want to know what is reasonably required for that.
Consider something simpler when
- Almost everything lives in one system.
- There is no question you currently cannot answer.
- Nobody is given time to guard the definitions.
- You share nothing outside your own organization.
- The manual work is limited and does not grow with the business.
- You expect AI to take over work without anything about the data changing.
Glossary
Data foundation: The whole of connections, definitions, meaning, access and stewardship that makes information usable for decisions.
Connector: Software that pulls data from a source system automatically, including validation and lineage.
Semantic layer: The place where it is recorded what a field means and how it relates to other fields.
Row-level security: Access at row level: every user only sees the data that belongs to them, regardless of the route through which they request it.
DTAP: Development, test, acceptance and production: four separate environments in which a change is built, tested, approved and only then rolled out.
Closing
The question we start every engagement with is not about technology, and the answer rarely comes from the IT side.
The opening question.
Which recurring decision, manual action, reporting process or service to your customers would improve most if the underlying information were connected, reliable and securely available to the right people?
Try that question on someone in your company who is not responsible for it. Usually that person knows the answer exactly, and has just never been asked.